That could be the entire post, really.
For context, this morning I was reading a cool post by Courtney Milan about estimating the value of your book’s rights. In it, she compares the value of a hypothetical trad contract vs. what you’d earn self-publishing it. Overall, it’s a very reasonable piece that isn’t about banner-waving for one side or the other, but is rather about assessing the money value of either option so you can make the best decision about which route to take.
The problem, sort of, is that she compares both examples over a 35-year span. On the one hand, when you’re talking about book contracts that can for last decades beyond your death–although she points out the rather neat fact that all authors can reclaim their rights after 35 years–it’s perfectly valid to assess the long-term pros and cons about signing such a contract.
On the other hand… who knows how things are going to look 5 years from now, let alone 35.
So, given that the future of the book industry and ebooks in particular is so unknowable, there’s an argument to be made that up-front money–i.e. an advance–should be weighted more heavily than long-term royalty projections. Which isn’t to say I think Courtney’s wrong; her projections sound very reasonable, and thus helpful in reaching a decision about what to do with your book. This is just something to think about.
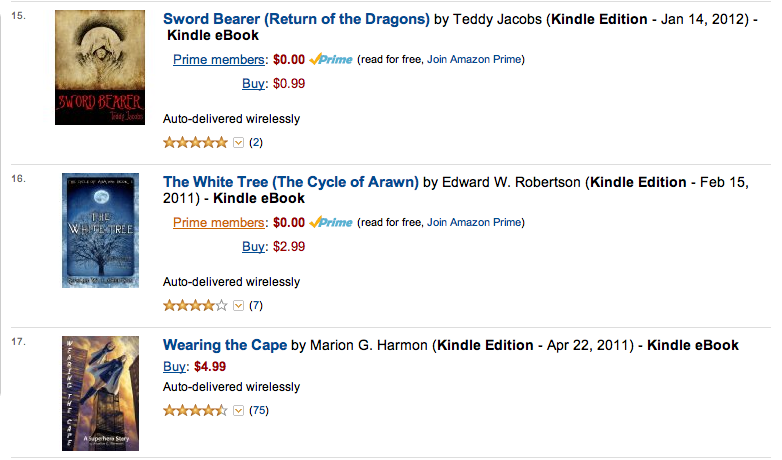
Anyway, over the course of discussing the ongoing chaos that is present-day publishing, I went to look at how many new ebooks are currently being published. Late last December, I noted there were 1.8 million titles in the Kindle store. Checking the numbers today, there are just over 2.1 million.
300,000 new titles in a little under 8 months.
Prorate that for the rest of 2013, and that’s roughly 472,000 new books.
1293 every day.
54 per hour.
A new ebook is being published to Amazon almost every minute.
I don’t have any particularly strong insight into this. Besides maybe “Holy shit.” But, to circle back to long-term projections, if books continued to be published at the current rate, then 35 years from now, the Kindle store would contain about 18,620,000 books. Nearly nine times as many titles as are available today.
Or not, because 35 years from now, there may well not be a “Kindle” store. I have no earthly idea.
For the record, I’ll readily admit that “Oh man I have no idea how to even begin to approach this” is far less useful than “Here is one method to help you assess the value of your book rights in regards to whether to sell them to a publisher or maintain them for yourself.”
I think Courtney has laid out a very good process for decision-making. It’s a great post. But hard numbers can provoke confidence. I would like to use a few other numbers to illustrate how far away publishing in 2013 might be from publishing in 2048: one (book per minute), half a million (per year), nine (times as many as we have now).
Books don’t sell in the summer.
Traditionally, the seasonality of book sales is decidedly Southern Hemisphere. Better sock away those December riches, because come July, it’s going to be slim pickings. Back when I was querying agents, summer was advised as both an unusually good and an unusually bad time to do so, because the publishing industry supposedly shuts down until adults come back from beaches and kids go back to school.
Dean Wesley Smith chronicled the “summer slump” here, stating publishing houses punted summer because “it was known that the lowest time for buying books by customers was May through the middle of September.” Despite the ebook/indie revolution, “That has not changed.” Just last week, Digital Book World led an article with “Typically July is one of the slowest months in book publishing.” Google “summer slump” and “book sales” and you’ll find dozens of indie authors advising other indies how to make it through the doldrums without losing hope even as sales (and incomes) slide away into the ooze.
I ran into this same phenomenon myself last year. Great May/June, okay July, then a long, steady slide, until my October was so bad–about $860, as my primary job–I was starting to wonder whether I could keep doing this. Thankfully, a new release turned things around.
Yesterday, someone on KBoards asked whether, in order to avoid the summer slump, they should wait to release their next book until fall. Given what we know, it’s a good question. There’s just one problem.
Books sell just fine in summer.
eBooks do, at least. If you compare the number of sales needed to sustain a given rank on Amazon’s Kindle store, to my eye, it’s the same in July as it was in February. As per the quick and dirty formula I tossed out in that post, to determine how many copies a Kindle title is currently selling, take 100,000 and divide it by its sales rank. Or, to put it another way, rank x sales = 100,000. This rule of thumb comes close whether you’re selling 1/day or 1000/day.
Let’s look at the rank and daily sales of several titles from this July and see how they compare to the numbers from February.
Rank x Sales = Score ; Estimated February Rank
#95,000 x 1 = 95,000
#2429 x 50 = 121,450
#852 x 120 = 102,240
#819 x 136 = 111,348
#767 x 148 = 113,516
#325 x 280 = 91,000
All right, whole bunch of numbers. What are we actually looking at? An easy way to conceptualize this is to go to the extremes. If Amazon sold so few books that all it took to rank #100 was 1 sale/day, you’re looking at a score of 100 (#100 x 1). By contrast, if it was selling so many books that a rank of #100 required ten million sales/day, your score is 1,000,000,000 (#100 x 10,000,000).
To put it another way, say that it took you 100 sales yesterday to rank #1000. If today it took 200 sales to stay at #1000, that would mean all the books above you were suddenly selling much more, too. Yesterday, your hypothetical score was 100K; today, it’s 200K.
Thus a lower “score” is indicative of lower storewide sales volume while a higher score means more ebooks are being sold on Amazon each day.
Across a broad range of ranks, the average score of those seven books above is 107,793. If anything, more Kindle books are selling right now this summer than were selling in the weeks immediately after the Christmas boom had calmed down.
For ebooks, the “summer slump” is a myth.
Of course, it isn’t quite that simple. While the sample size leaves something to be desired, the most obvious qualification to this methodology is that the “100,000 formula” isn’t a real formula, but more of a rule of thumb. It’s imprecise. Back in February, for instance, it was also true that 10 sales/day would sustain a rank of #12,000, and 120,000 ≠ 100,000.
So if you think I had my original score wrong, and you believe 120,000 was “normal,” then our current score of 108,000 would indicate sales are down by 10% from February.
For most ranks I was looking at in February, however, the score was closer to 100K. Largely in the 95-110K range. To my eyes, the current score of 108K is virtually identical to February. And the number of sales needed to sustain that #12,000 rank was the same in February as it is right now in late July.
That, to me, is the key takeaway: Amazon ebook sales may be down for the summer, but it is not immediately obvious. It’s even possible they’re up. If the slump is so small it can’t be detected, I don’t think it can be called a “slump” at all.
Want to know how many sales a given Amazon Kindle rank represents? Here’s a quick and dirty formula:
100,000/rank # = sales per day
In other words, if a book’s rank is #100, then 100,000/100 = 1000 sales/day. If a book’s rank is #1000, then 100,000/1000 = 100 sales/day. At #100,000, then 100,000/100,000 = 1/day.
The formula breaks down at the extremes. It probably overestimates the sales of the top 100 books by a little, and the #1 book in a given day probably sells much more like 10,000/day than 100K, although as ever, at the top, it varies tremendously. And at #1,000,000, that’s not a book that sells 1 copy/10 days. We’re talking about a book that might not have sold more than 1 copy ever, or at least within the last 6 months.
Overall, though, it’s a pretty good rule of thumb. It’s probably a little conservative–tack on 10-20%, and you’re probably closer to the truth for most ranks–and it also depends on factors like velocity of sales in the last 0-48 hours, so books that have recently been boosted by a sale may be +/- 50% of the sales numbers or more. Also, a book that has hung out at a certain rank for a while needs fewer sales to maintain that ranking long-term.
Treat it as a guideline, though, and it’s pretty close to the truth. Does that mean you could extrapolate it to estimate how many ebooks Amazon sells per day? Yes. You totally could.
Anyone who follows this blog knows that last May, Amazon drastically changed their popularity lists (available on the left sidebar of the main Kindle store) to change the way free downloads were factored into the ranks. On last week’s Self-Publishing Podcast #42, I was asked whether this change was done in order to present readers with better books.
The short answer: yes.
The longer answer: not necessarily better books, but certainly more profitable ones. That’s a very important distinction to make right off the bat. In all media, there’s an ongoing, centuries-long debate about whether a work’s value is based on its commercial appeal or its artistic qualities. As it turns out, I have nothing to contribute to that debate. So what follows should in no way be taken as a judgment of books that have failed to thrive under the recent Select model. Some of my books did worse as well.
But here’s what we know. Between the birth of the Select program in December 2011 and mid-March 2012, all it took for a book to hit the first few pages of its category after a free run was a few hundred downloads. 2000+ would essentially guarantee you’d be near the top of your category, probably for 2-5 days. Because a free download was weighted the same as a paid sale. And very few books are currently selling hundreds of copies per day on Amazon. Right now, about 1000 sell 100/day. Maybe 500 sell 200/day. And only something like 100 sell 500+/day. The numbers were a little lower a year ago, but not by all that much.
Meanwhile, every day, freebie aggregate blogs were pointing their readerships toward several dozen free titles. The biggest blogs had tens of thousands of subscribers, more or less guaranteeing every book featured would pick up at least 1000 downloads. There was some level of curation involved–covers had to be at least halfway decent, and there was typically a rating threshold of some kind–but the blogs had no real way to test the commercial potential of the books they mentioned. And when a book is free, the resistance to downloading it is much, much lower than when that book has a price tag attached to it.
The result is that a lot of books with lower commercial appeal wound up displacing books with higher commercial appeal. On Amazon’s popularity lists, 1000 free downloads beat 100 paid sales, and new Select books were picking up thousands of free downloads every single day. The gatekeepers weren’t strong enough to keep out the low-appeal books, meaning readers were less likely to buy the books in front of them or to be satisfied with the titles they did purchase.
What was the solution? Well, Amazon wasn’t about to start curating these books themselves. Amazon is all about letting massive numbers of consumers reach their own decisions, proving in the most meaningful possible fashion which books have the highest commercial appeal. So some churn of their lists was probably a good thing, as it broke up the stagnation of long-term bestsellers (by the way, the iBookstore is currently struggling with this problem) and presented more voracious readers with fresh material. But this was too much, and it was too unregulated.
The answer was to raise the standards for which books would get prime placement. And in typical Amazon fashion, they would tie that standard to consumer behavior.
In March, they started testing new popularity lists; in May, there was a new algorithm. The winner no longer weighted free downloads equally with paid sales, but at something near a 10:1 scale. And instead of weighting the last 1-7 days of sales + downloads, it looked at the last 30.
So instead of needing 2000+ downloads to land high on the charts–a number most decent-looking books promoted by the top sites could cross; about 100 free books managed that number of downloads per day–their new formula required somewhere between 8000-20,000 downloads to really hit it big. The more niche or iffy books couldn’t hit those numbers anymore; fewer than twenty per day could climb those heights. With exceptions, the only books that could rake in that many downloads were the ones that would have guaranteed commercial appeal when plunked in front of readers. The gatekeepers–readers, making their download decisions one click at a time–were made stronger.
They crowdsourced commercial appeal. In the environment of the time, one or two or three thousand readers downloading a free book wasn’t a terribly accurate predictor of that book’s potential. But if you upped those numbers ten times over–to ten or twenty or thirty thousand reader downloads–you had a much more accurate barometer for which books would sell when they were awarded with extra visibility.
It was a net gain for readers, who had an easier time finding appealing books, but a net loss for writers, fewer of whom could pull in the number of downloads required to hit the jackpot.
Again, I’m presenting this without judgment. A book’s surface appeal, which prompts free downloads, doesn’t necessarily represent its deeper appeal, which prompts word of mouth and long-term sales (to say nothing of literary or artistic appeal). And Amazon’s current algos aren’t perfect. Certain factors–the readership demographics of the major blogs, crossover appeal of the larger genres, Amazon’s categories, etc.–means that certain subgenres (romance, thrillers, etc.) have an easier time of it than more niche subgenres (epic fantasy, Westerns?, etc.).
This is just my narrative of what happened. Amazon’s standards/algos weren’t high enough to deal with the emerging free book market; the rewards for making your book free were disproportionately high compared to their average commercial value.
So they raised their standards. And a lot of authors were left scrambling for a new solution.
~
The silver lining to these changes is that we as authors can take advantage of the raised standards to gauge the appeal of our own books. But since this post is already closing in on 1000 words long, I’m going to tackle that in a followup.
Over the last few months, I’ve grown disillusioned enough with Amazon Select to pull my book Breakers from the program. Yesterday, its exclusivity expired. Today, Breakers is available on Barnes & Noble for the Nook reader.
It should be in Kobo as well at some point, but it appears to be stuck in publishing at the moment.
Selling beyond Amazon is a tricky proposition. Amazon has a lot of different places for a book to be discovered–bestseller lists for free and paid titles, popularity lists, hot new releases, alsobots, email recommendations, its internal search engine, etc. Between all these venues, as well as the Select program, it’s possible–not easy, but possible–to actively sell your book through a number of different methods. Methods which authors talk about all over the place.
For stores like iTunes and Barnes & Noble, however, the only really effective method I’ve heard about is “write a series and make book one free.” Common wisdom holds it’s possible for romance and erotica to sell well on B&N. Everything else, however, tends to sink into the morass, which is why, when it comes to the non-Amazon storefronts, indie authors’ most common reaction is the e-equivalent of throwing up their hands and muttering to themselves.
Self included. The entirety of my non-Amazon strategy to date has been to make one of my novellas free for nearly a year. That did approximately nothing to spur sales of my other titles, even before I started pulling them to go into Select. And in the first two months since returning to paid, that novella has sold 11 copies on iTunes and 0 on B&N.
In other words, I’m clueless.
But that’s what I’m hoping to address now. I know that Breakers can sell when it’s in front of people, so unlike my other titles, if I can find a way to get it some visibility in the other stores, it should sell. Hypothetically. So how do you find that visibility?
With B&N, new releases appear to get a bit of it. Since going live over there, Breakers has sold 3 copies, which a) I’m almost certain is attributable to being automatically added to the new release listings, and b) has already made me more money than I’ve ever made in a single month at B&N. New releases seem to be listed for up to 90 days over there. The default sorting appears to be by “Top Matches,” whatever that means. It could be an algorithm of some kind, or it could be codeword for “a big publisher paid us for this placement.”
Virtually everything on the first 100 default titles of Science Fiction & Fantasy, All New Releases is a trad book priced between $7.99-14.99. The few exceptions near the top are trad authors publishing short works (Terry Brooks and Laurell K. Hamilton). There are a handful of indies in the last ~30, some of which are free. All of these books have nice sales ranks. If you’ve got a series, it might be smart to start it out in Select, then pull it out once you’ve got 3+ titles and try to create instant momentum for the rest of the series by making the first book free and hoping its New Release placement will pull the rest of your books along behind it.
Beyond that, though, it looks like B&N shoppers have to do some pretty active searching to find any new releases that aren’t big bestsellers. Bummer.
Bestseller rank on B&N is less volatile/more sluggish than on Amazon, by the way. For instance, a single sale of a new release on Amazon would put your initial rank around #50,000; Breakers, with three sales (only one of which might be counted toward its rank) is currently #379,078 on B&N. I saw the same thing with my free title: over the months, roughly 1000 downloads pushed it up to something like #15,000 in the ranks. With no paid sales three months later, it’s still at #51,251.
What this means in practice is it’s harder to attain a high rating, but once you do, it’s easier to stay sticky. This is another reason trad books sell much better there while indie books have a hard time gaining traction. But if you’re an indie with a big old fanbase, you can probably do pretty well for yourself.
Well, none of this is encouraging so far. On the plus side: 3 sales so far isn’t nothing. If I wind up averaging just 1/day at B&N, I’ll consider it a success.
I’ll try to come back to my progress at B&N a week from now. By then, I hope to be up and running at Kobo as well. I’ve also applied to sell directly through iTunes, but I have no idea when or if I’ll be granted access. I probably should have applied for that weeks or months in advance. Learn from my mistakes, people!
So when we last left off, Breakers‘ free days had rolled off its popularity list rankings. That process took three days to finish (since it had been free for three days). Within a week, its sales had dwindled from 50-70/day to 10/day. I still had decent pop list placement, because it had sold so many copies in the last 30 days, but as each day passed, its pop rank continued to slide, because the old high-sales days were being replaced by new low-sales days. The end was night.
All the while, I was having a pretty obvious thought. If a big free run had propped it up in the first place, what if I did another free run? I probably couldn’t match my previous total giveaway numbers, but if I made it free while it still had a lot of paid sales credited to it, would that be enough to boost me back up the lists and continue the ride for another thirty days?
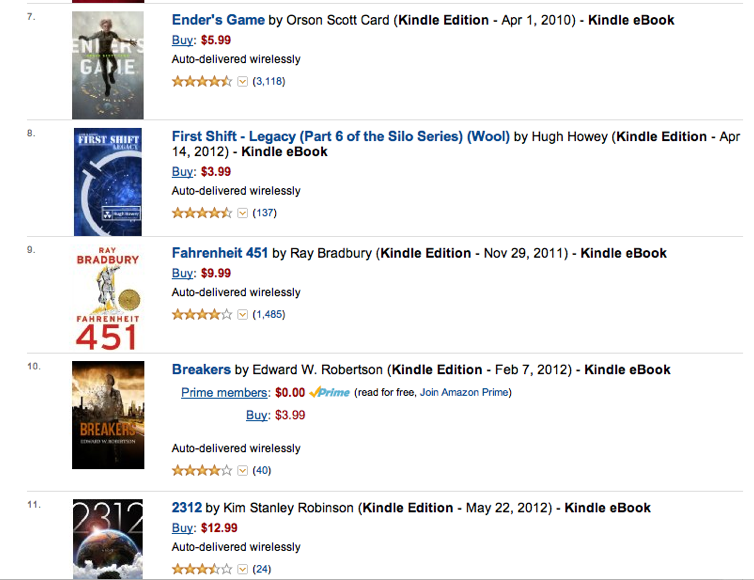
Meanwhile, I was having a second, far less reliable thought, because my brain can’t leave well enough alone. The thing is, Breakers was outselling a lot of the big sci-fi books around it on the pop list. Its bestseller rank was consistently better than Ender’s Game, for goodness sake. If the pop lists were calculated purely by sales, it wouldn’t have fallen off at all. The only reason it did drop relative to these other books was because they were priced higher, and ever since the beginning of May, price is weighted heavily in how the pop lists are ranked.
So what if I raised the price, too? Before, I was selling at $3.99. Would my sales hold steady (or close to it) at, say, $5.99? If so, when my latest free run ran out in another 30 days, would I be able to avoid eating cliff? Or at least suffer a less painful, more gradual decline?
So I set it free again. For two days. That was all the days I had left. And I waited to see what would happen.
And then Amazon botched my promo.
Instead of starting on June 23rd as scheduled, Breakers didn’t wind up going free until around 2 AM June 24th. I emailed KDP and called AuthorCentral (KDP has no phone number), but KDP was no help. That left me with just under one day to get as many downloads as I could. When it finally did go free, things went about as well as I could have hoped–POI picked me up, and so did ENT–and I finished the day with about 5600 downloads. On the one hand, that was really good, but on the other hand, with another day, I probably would have finished with between 8000-10,000. I needed every one I could get to restore my lost placement.
In the end, it wasn’t quite enough. I bounced back up the pop lists, but not as high as before. Initial sales were pretty good (25-30/day), but even at the higher price, it wasn’t enough boost to keep up with the higher-sales days of 30 days ago that were continuing to roll off my rank. I think my worse bestseller rank was hurting me here, too, but it’s really hard to say. Sales held steady for about ten days, then halved after July 4.
Since that end of the experiment was a bust, I decided to learn what would happen if I raised the price to $7.99. Interestingly, sales held steady around 10/day for another couple weeks. Three weeks out, they halved again. A few hours ago, Breakers ate cliff again, falling from #27 in Science Fiction > Adventure to #113. I’m guessing its sales are going to be pretty slow from now on. (Well, until more magic happens, anyway.)
For all I know, the higher price crippled its ability to stay as sticky this time, too. But I don’t think that’s the only factor. Over the last couple months, I’ve watched several books try this same trick–doing regular free runs to prop up their pop list rank for another 30 days. Every time, they don’t come back as strongly as before. Don’t get me wrong, they still do very well–coming back at #1500 instead of #500, say, or #2200 instead of #1500–but there is, in this limited sample size, a clear trend of diminished returns.
What’s happening? Are these books, including Breakers, slowly exhausting their audiences, even with similar pop list placement as before? Is it the case that, after an initial giant free run, a book is essentially experiencing what it’s like to be a popular new release, and when it pops back up after its first cliff, it’s being met with a lot of eyes that have already seen it?
Likewise, these books’ second and third big free runs are never as big as their first. Not that I’ve seen, anyway. The obvious conclusion–which isn’t to say the correct one, necessarily–is that they’re draining the well, so to speak. Massive free runs depend on just a handful of sites. Once you’ve tapped those sites once, the well has that much less water in it the next time you return. It refills over time as new subscribers sign up, but in my observation, it doesn’t refill completely within 30 or even 60 days. In fact, it may take much longer than that.
We’re back in the realm of speculation now. But the logical conclusion is this that riding free runs every 30-40 days can be an effective strategy (although ENT now says they won’t mention a book within 60 days of the last time it was free, meaning you’re basically down to POI, FKBT, and paid ads for exposure). This can last for several months, anyway. But it appears to be less effective the more you do it, and there is a point where a diminished 30 days of sales + a diminished free run isn’t going to be enough to prop you up to a significant place on the pop lists. When that happens, the run’s going to be over for a while. At least until the wells refill. Or you discover some other way to get your book back up there.
There’s also the question of whether giving away that many books might hurt your long-term sales. I have no answers to that question. People are buying their first ereaders every day. Considering there are already millions of Kindles out there, giving away 50,000 copies of your book over the course of a year may be a drop in the bucket of your potential audience. Readers aren’t a nonrenewable resource. Still, I don’t think it’s an unreasonable question, especially if you might be better served waiting to reach those readers for when you’ve got the next book in the series ready, say.
This is getting far afield. Nearly three months after the new algorithms spraing into being, here are my conclusions, which may or may not be remotely accurate:
* The Select program continues to reward far fewer books in the past
* The few books it does reward are well-positioned to continue to exploit their appeal
* If timed right, and with the right luck, these books can chain several months’ worth of strong sales together
* However, there will likely be diminishing returns after two or more of these runs, and it is unlikely to be something that can be maintained for more than a few months in a row
* While Select may no longer be very useful for most single titles, it continues to be quite useful for series
As for me, I’ll be leaving my fantasy series in Select for the time being, but I’m letting Breakers‘ Select contract expire early next month. I’d like to explore the other storefronts with a book I know is capable of selling. I’d like to see if I can build sales that are less roller-coastery. And to be perfectly frank, I’m pissed off at Amazon’s shitty customer support (grumble grumble bitch&moan). I’m sure they will be devastated to have lost my exclusivity.
What might this mean for your book? That is virtually impossible to answer. Maybe you’ll strike it rich on your next free run, but the chances of that are pretty low, unfortunately. And the strategy discussed above certainly isn’t a long-term plan (although giving away and selling that many copies may build you a readership that is very long-term indeed).
At the same time, what’s the alternative? De-enroll from Select, push the book to all the other stores, and pray it catches on? That’s not exactly an active strategy. Yet the other stores don’t have the same kinds of tools for discoverability that Select provides. It’s possible to make books free on iTunes and Kobo, yes, but that doesn’t result in the same list placement going free provides on Amazon. (Well, it kind of does on iTunes, but it’s clumsier, it takes much, much longer, and it’s far from guaranteed.)
In other words, we’re still in the same boat we’ve been in since mid-March. Select doesn’t sell like it used to, but the other sites are a cross between a roulette wheel and a wasteland. I’m growing restless and disillusioned, so I’m going to go exploring. I don’t know what you should do, but I’ll report back with anything interesting I find along the way.
Last time I looked at Amazon’s current algorithms, I speculated what would happen 30 days after Breakers‘ giant free run. At that point, all the free copies it gave away would stop counting towards its rank on the popularity lists. That was a frightening prospect, but at the same time, I’d racked up some 2300 paid sales (and another 600 borrows) in the 30 days since my giveaway. Would those be enough to sustain my place on the pop lists? If not, what would happen? Would I face a slow decline, or a swift one? Would I stroll down a hill, or smash down a cliff?
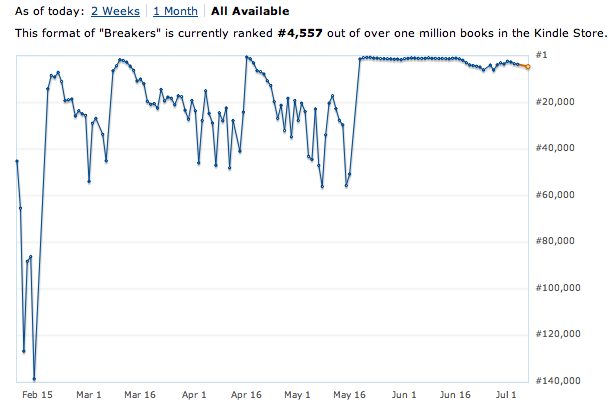
Well, here’s a look in chart form. Here’s Breakers‘ entire sales history:
 |
| Pictured: D’oh |
That doesn’t look so bad. That nice, flat line goes on forever and ever. It’s just a little jagged there at the end is all. Wait, let’s take a closer look:
 |
| Pictured: D’oh, Part 2 |
Okay, that’s a better look at what happened. What we’re seeing here is twofold. First, notice that downward slope starting around June 16? That’s when my free days stopped counting. The descent was swift–nearly 1000 ranks a day until I hit #4000, when the decline slowed. That is not a gentle hill. That is a brutal cliff. The drop from #1000 Paid to #2000 Paid is the difference between roughly 70 sales per day and about 40 sales/day. And rank declines more slowly than it rises, meaning my drop was even stiffer than that. Within a week of my free days beginning to roll off, I’d dropped from #1000 to #5000. In terms of daily sales, that was a drop from 50-70/day to 10/day.
I had braced myself for it, but it’s hard to brace yourself for a freefall. Mostly what happens at the end of the cliff is a puddle composed of you.
“But wait,” you say. “Bottoming out at #6000 isn’t so bad. That’s a pace around 500 sales/month. And anyway, rank spiked just a few days after that, taking you back to #2000. What are you bitching about?”
What am I–? Look, we’ll get to that in a moment, Captain Impatience. First, I want to talk about the why some more. Why such a steep decline? After all, my bestseller rank was still really good. #1000 overall, which was something like #8 in Technothrillers and #22 in Science Fiction > Adventure. That’s quite a bit of visibility, isn’t it? And what about also-boughts? At that point, I had a lot of popular sci-fi books pointing back to Breakers in the form of the “Customers Who Bought This Item Also Bought” lists.
Well, it turns out those things just aren’t all that important. Ha ha! That is way too flippant of an answer. Totally misleading. In truth, bestseller rank and alsobots clearly matter to some degree, but the more I do this, the more dismissive I am of them in general: while they certainly help generate sales, the bestseller lists are so volatile your book can sink extremely rapidly, and the alsobots are such a harsh filtering process (basically, your book needs to be on the first page of a book that has just been finished by a reader who is interested in buying another book right now) that they are of limited use. I think if you have a very high bestseller rank, or first-page placement on the alsobots of a very popular book, then that can do a lot for your sales, but otherwise, those are the supporting cast to a book’s sales, not the star.
The star is the popularity lists. And your book isn’t on just one of them, it’s on a bunch. For instance, one of Breakers‘ category paths is Kindle Store > Kindle eBooks > Science Fiction > Adventure. Each of those is a separate popularity list, which means the book is listed (somewhere) on each of them. Say it’s showing up at #20 on > Adventure; that would place it somewhere around #40-50 in > Science Fiction, and somewhere like #1200-1600 in > Kindle eBooks. In terms of discoverability, it would be very easy to find in SF > Adventure (second page), pretty easy to find in > Science Fiction (page 4-5), and totally awful in > Kindle eBooks (page 100+). No one is going to click through 100 pages in the eBooks category to find it. But this is part of the reason mega-popular books like 50 Shades of Grey or The Hunger Games stay so sticky for so long: when you’re #1 in the store, everyone sees you every time they visit Amazon. Plus the whole “world-destroying word of mouth” thing. But extreme visibility in high-traffic categories leads to a lot of clicks on your book, which in turn generally leads to a lot of sales.
That’s essentially why Select free runs used to do so well on the old pop lists. And that’s why taking a sudden tumble from, say, #10 in > Science Fiction (where I peaked)–the first page of the entire category–to #40-50 or wherever makes such a big difference. And remember, you’ve got another subcategory you’re listed on, too. Once your visibility is lost when a big free run rolls beyond the pop list window, you’re not going to regain it without another push.
 |
| Breakers’ peak rank on the Science Fiction popularity list a week before I ate cliff |
In my last post examining the effects of a large free run under the current algorithms, I looked at how Breakers‘ sales had been in the week after giving away 25,000 copies. They looked steady. And given that the book would have very strong position in the popularity lists for 30 days, my best guess was that sales would stay strong throughout that period.
Still, that was just a guess. And I thought it was also quite possible that sales would slow. Significantly so, even–maybe regular browsers of the popularity list would all snap it up in the first few days, leaving it much more sluggish after that. There was no way to know for sure until more numbers came in.
Okay, by my count, it’s now been 17 days since Breakers reverted to paid. Here’s a look at its last 30 days of sales:

That is a line. An almost-straight one. That line represents numbers that are frankly humbling and my-mind-blowing; I’m not sure how to address this without it coming across as bragging. That line represents some 1250 sales and 400 borrows.
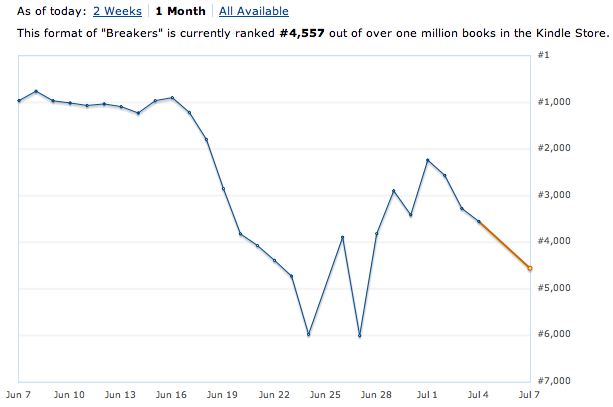
Yet it’s also a bit deceptive. That graph is measuring all numbers between #1 and #60,000. How does it look at a more micro level? Here’s the graph for the last two weeks:

By Authorcentral, it peaked May 22, ending the day at #550. It declined every single day after that, reaching its nadir at #1583 on May 31. On June 1, it leapt to #1099; it reached #821 by June 3, and while that graph isn’t showing its latest increase, at 12:45 PM June 5, it’s at #852.
What caused the rebound? Borrows are a big part of it. Breakers has been listed at #1 in Science Fiction in the Kindle Online Lending Library for at least a week now. Despite the top placement in its genre, in the last four days of May, Breakers had 37 borrows, averaging 9.25/day. In the first four days of June, it’s had 110–27.5/day. Clearly, most Prime members had exhausted their monthly borrows by the end of the month; as their borrow refreshed June 1, many new readers snapped up the book.
But an extra 18 borrows a day isn’t quite enough to boost it from #1600 to #800. The borrows can be explained by the start of a new month, but raw sales are also up, too, from 57.75/day in the last four days of May to 77.5/day over the first four days of June. That’s a 34% increase(?!?).
How to explain that? I don’t know. Its pop list ranks have been steady for days now. Presumably, as borrows came in, boosting Breakers‘ rank on various bestseller lists, the additional visibility led to a few more sales, but I don’t think that’s the only–or even the primary–driver of these extra sales. Its bestseller ranks haven’t rebounded that much. All I can offer on this front is conjecture: Are shoppers more free with their money early in the month? Does Amazon send out extra recommendation emails at the start of the month? It’s also gotten 23 new reviews since going free (it had just 9 before); is that helping to convince shoppers to click “buy”?
I don’t know. All I can conclude is that a free giveaway can pay off heavily in borrows as well as sales–right now, Breakers is #12 on the popularity lists in all Science Fiction, but none of the books above it are enrolled in Prime, meaning it gets the #1 spot in the KOLL. The frenetic pace of early-month borrows is already slowing, but that was a nice shot in the arm–my sale : borrow ratio is currently at almost exactly 3 : 1. I believe very few of those borrows are cannibalized sales. My gut feeling, having seen numbers on a bunch of other books, is that a more “normal” sale : borrow ratio would be more like 10 or even 20 : 1. In other words, a full ~25% of my total income so far this month is directly due to having such ridiculously high placement in the KOLL.
17 days in. That gives me another 13 before my free downloads slide beyond the 30-day window of the popularity lists. In another two weeks, then, I expect the gravy train to run out of steam. Possibly to fly off the rails altogether. But it won’t vanish from the popularity lists altogether–by then, it’ll have somewhere in the neighborhood of 2000 sales credited to its ranks, meaning it might only drop from page 1 to page 2 or 3. Even so, that could lead to a death spiral, a negative feedback loop where lower visibility –> lower sales –> even lower visibility –> even lower sales, but we’ll see.
Wherever it goes from here, I can’t consider this as anything but a success. It’s been fascinating to watch, and from a personal angle, it couldn’t have come at a better time–my fiancee’s workplace is reducing everyone’s hours, and our ability to scrape by, already rocky, might have become downright jagged. Even if it crashes and burns in another two weeks, it’s already saved our bacon.
UPDATE: The same day I posted this, Amazon changed their sales algorithms again. This post will provide a lot of the background to what I talk about in the followup post.
BACKGROUND
Around March 19, Amazon changed the way they sell books. In a Kindleboards thread devoted to the subject, authors tracking the performance of books during and after a free promotion began reporting strange results. Prior to then, books that gave away several thousand copies during a promo would shoot to the top of the popularity lists some 36-48 hours later. It was like clockwork. Clockwork that paid you several hundred dollars.
Because the popularity lists are a big deal. These are the default book listings you’ll see when you’re browsing around by genre. Here’s the Fantasy list, for instance, with GRRM clogging up the top 10 like the greedy goose he is. If you could ride a free promotion to the top of those lists, your book would be extremely visible to shoppers. Depending on genre and your book’s presentation, topping the pop lists could snag you dozens or hundreds of sales before other books overtook you. Sometimes that visibility was enough to launch a book into the stratosphere, where the stratosphere is also made of money. It was kind of a big deal.
Then, things changed. Except they didn’t change. Not for everyone. Authors began reporting lower sales than expected as well as strange-looking lists. Chaos reigned! Dogs and cats living together, watching couch-bound authors tear out their hair. After a couple weeks, we thought we had it figured out: there was no longer a single popularity list. There were two, and books no longer seemed to be vaulting to the top no matter how many free copies they gave away.
Well, we were wrong. There weren’t two lists. There were three.
Because I am extremely imaginative, I’m going to refer to them from here on out as List A, List B, and List C. I’ll get into the methodology in a bit, but for now, I worked this out through carefully observing my books, reading other Kindleboard authors’ results obsessively, and lobbing theories around with other authors. I would never have figured this out on my own. I know, never say never. Trust me, eventually I would have gotten frustrated and left to play Mario Kart instead. One other author in particular did tremendous heavy lifting. Like the Eye of Sauron, he (or she?!) is far-seeing and awesomely powerful. And much like Sauron, you can’t invoke his or her name without facing terrible wrath. Some of the Eye’s secrets must remain just that.
But the outcome of that info can be revealed. So without further ado, here’s how the three lists work.
THE CHANGES
List A is the same version of the pop lists that existed prior to March 19. It is Select- and freebie-friendly. Here’s roughly how it works:
- Ranks are heavily weighted to the last few days
- Free book downloads are weighted equally with paid sales
- Borrows count as sales
List B appears to be a throwback pop list, one that was running throughout most of last year. Here’s how book ranks are calculated on it:
- Ranks are determined by the last 30 days of sales, with no extra weight given to the most recent sales
- Free book downloads are discounted heavily–maybe as little as 10% the value of paid sales
- Borrows don’t count as sales
List C is a lot like List B, with a couple major differences:
- Free book downloads aren’t counted at all
- Recent sales are weighted somewhat more heavily than List B(?)
- Borrows don’t count as sales
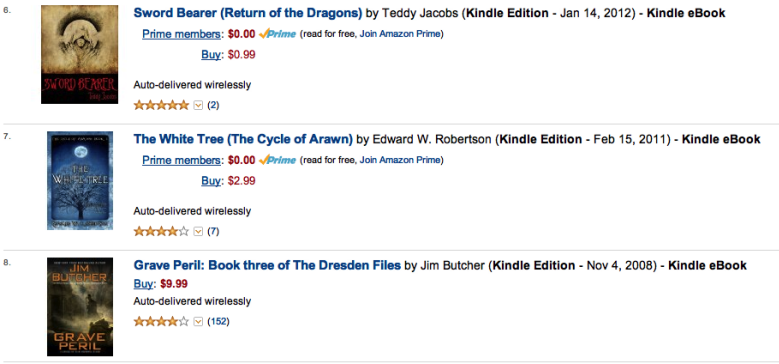
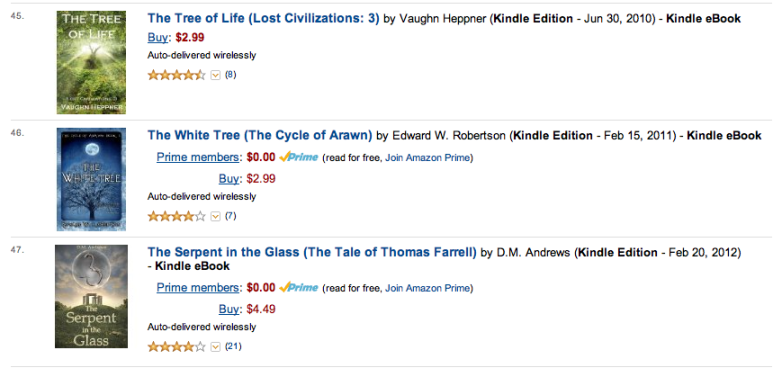
What does that mean in practice? A lot. A lot a lot a lot. Here’s where my book The White Tree ranks on all three lists at this moment in time. Each shot will look a bit different because they’re taken from different browsers–that’s one way to see different lists. The list in question is Fiction > Fantasy > Series, a fairly quiet little fantasy subcategory.
List A:
List B:
List C:
Pictured: Oh shiiiiii–
METHODOLOGY
Most of this was achieved through comparing tons and tons of different books on different browsers, just like the screenshots above. Here’s some stats for the book in question that helped me figure out what was happening here. On March 28-29, The White Tree was downloaded 4700 times (free). On April 17, it was downloaded an additional 1300 times. In April, its paid numbers came in at 210 sales and 46 borrows.
Since March 19, my main browser’s been displaying List B. My big clue to List B came on April 28, when I noticed my book had, over the span of a day or two, dropped from #67 in Epic Fantasy to #165. Rank didn’t slide–it instantly dropped off a cliff. Why? Because it had been 30 days since all those free downloads had come in. I’d noticed the same thing around March 23–I’d done a huge giveaway February 22-23, and once 30 days elapsed, it suddenly plummeted from around #45 to around #255. I didn’t know what it meant then, in fact I don’t think I even knew there were two lists at that point (let alone three), but when it happened again, I had a pattern.
I also had several weeks of observations piled up by then to help me understand new data. For weeks, List B had been showing me very static lists. The books at the stop stayed at the top. There was very little churn. There were very few Select books, i.e. books that were likely to have recently been free, especially within the top ~60 results (first five pages). Most books at the top were traditionally published. List C was even more trad-dominated; generally speaking, an indie title on List B would be ranked 15-25% worse on List C if that title hadn’t been free, and would rank much, much worse if their List B rank was dependent on free downloads (like, hundreds of places).
When I compared the top 240 titles in Epic Fantasy between List B and List C, here’s what I found: on List B, 188 titles weren’t in Select, and 52 were. On List C, 217 titles weren’t in Select, and just 23 were. With no benefit from freebies, and with fewer paperback sales to pad the numbers, most indies get killed in List C.
When it came to figuring out that borrows weren’t counted in List B and C, The Eye of Sauron was particularly helpful. We compared Select books with lots of borrows to non-Select books whose sales were roughly equivalent to the Select books’ total sales+borrows. On List B and C, the non-Select book came out ahead by a good chunk. We compared Select books with lots of borrows relative to sales with Select books with few borrows : sales. (None of these books had recently been free, which acted as a “control” between List A and B.) The ones with a higher ratio of sales : borrows almost always came out better on List B than on List A.
While I wouldn’t lay my life on the line for every one of these observations, I am very confident in the overall conclusions reached. There are three different lists. You can see them for yourself–just compare lists on different browsers, computers, and Kindles. If you’ve gone free recently, you’ll note your popularity rank on List A is much better than B or C.
How do you tell which list you’re looking at? Well, that could take a day or three to figure out, but in short, if you see a bunch of Select titles on the first pages of the pop lists, you’ve probably got List A. If it’s almost all traditionally published books, it’s List B or C. From there, compare your lists on another browser/device; if you’re seeing List C, trad books will generally be even more dominant.
WHAT THIS MEANS
What does all this mean? Hey, maybe you haven’t noticed, but this post is already epically long. The internet is only so big, you know. I’ll save that for a future post. For now, here’s what’s key: there are three different lists. Your book is listed on all three, but any given shopper is only seeing one version of the lists. (In other words, different people see different lists.) If you’re an indie in Select, one of these lists is good. The other two? Well, let’s just hope they’re not here for too much longer.


Reapers

When the plague came, federal agent Ellie Colson fled into the Adirondacks with Dee, the daughter she barely knew. They began a new life as subsistence...
More info →